
Invalidation of the Evolutionary Molecular Clock-Neutral theory
Authors
M. Nailor, D. Joseph
ABSTRACT
Using the scriptural based Created Heterozygosity Model and calculating factors regarding physiological, environmental, and rates of geographical expansion. Predictions regarding mutation rates are made on Hominidae (humans and primates), Canid (Wolf, dogs), Vulpes (foxes), Felidae (cats). The implications of rapid mutation changes and increases in diversity has implications in molecular biology, genetics and medicine. Phylogenetic methods are put to the test against pedigree methods for accuracy, and determination of when the last bottleneck in animal life is also discussed.
The worldwide pattern of limited variation among all animal life, tells us that something physically happened in the recent past that reset all mitochondrial diversity at the same time. What was this? When exactly was this? Is genetic diversity still increasing today? Is a Universal molecular clock that is explained by neutral theory really the best explanation for all the diversity we see in life today and can it explain the patterns observed in nature? Are evolutionary phylogenetic mutation rates more valid than pedigree mutation rates? Can future predictions be made regarding different mutation rate models? These questions demand attention, as many paradoxes exist regarding these controversial topics.
INTRODUCTION
In this study, I puzzle together empirical studies with other theoretical concepts that can help us build connections between that which connects mutation to diversification. First, we must consider the different ways in which mutation rates vary between related species. Then we will consider how mutation rates affect substitutions via population size, demographic dispersal rate, geographic range size, migration, and reproductive isolation. Since the diversification rate today is measured from phylogenetic analyses based on evolutionary assumption. When phylogenies are reconstructed based on nucleotide sequences, such variation is typically accounted for by only using a relaxed molecular clock, which, however, is just a statistical distribution of mutation rates without any underlying biological mechanism. Without using this “relaxed” clock evolutionarily, many more discrepancies arise.
Current studies attempting to reconstruct the evolutionary phylogeny of a clade often discover that the sequence data in no way support the assumption of a strict molecular clock in Neutral theory, which is that of a constant substitution rate across lineages governed by generation time. For these types of problematic cases, evolutionists created phylogenetic inference software called “relaxed molecular clock models.” (Lepage et al 2007; Drummond et al 2006). These are nothing more than ad-hoc solutions to resolve an unresolvable problem in the evolutionary model and save neutral theory from falsification. What they have done by implementing this new relaxed clock is essentially allow an inconsistent clock in their neutral ticking only clock theory, to capture known contradictions and place them back into the phylogenetic evolutionary branches they need. Basically they have made a circle wide enough to capture everything that does not fit the evolutionary model and the data is now force fitted to agree even when it clearly disagrees. They have done this same shady move in paleontology and geology by saying that evolution is a slow process described by Darwin known as Gradualism. However when contradictions were abundant they allowed for stasis, punctuated equilibrium, and Saltationism. Basically allowing the theory of gradualism unfalsifiable nonsense, just as they have now done using neutral theory. Carl Woese, the father of evolutionary molecular systematics states: "Phylogenetic incongruities can be seen everywhere in the universal tree, from its root to the major branchings within and among the various taxa to the makeup of the primary groupings themselves."
-
Ford Doolittle explains, "molecular phylogenist’s will have failed to find the 'true tree,' not because their methods are inadequate or because they have chosen the wrong genes, but because the history of life cannot properly be represented as a tree."
For these reasons, I propose an alternative idea that uses a more logical approach and resolves these problems using observation, testing, and predictions as the basis for this study taken directly from the Created Heterozygosity model - CHM (Jeanson 2015).
Here, I present a more explicit biological explanation for differences in mutation rates across the Created bush of life; I propose that variation in accumulated mutations may be explained by many different mechanisms and factors like population size, geographical expansion, population growth and partly explained by reproductive isolation, hybridization, speciation and inbreeding. I will be critically evaluating the empirical evidence for these differences, focusing on the mutational pedigree methodology v.s. The phylogenetic methodology regarding neutral theory. The aim of this hypothesis and theory study is to explain that pattern of diversity through mutation rates is predictable using the CHM, and how a phylogenetic evolutionary universal molecular clock makes no testable predictions and cannot account for the patterns we observe in nature. We will be investigating how different factors shape the number and type of mutations that cause diversity and why some become fixed features of the genome while others do not.
Even though there are other factors of genetic change that may be drivers of diversification, such as regulatory changes, chromosomal rearrangement, and epigenetic modification. We will be focusing on recombination, gene flow, and point mutations since mutation alone is what is used as a marker for all diversity. This has been done from the start of the theory, as evolution believes that all diversity is the cause of mutation. The relationship between species has been documented by only comparing gene sequences between lineages. Therefore I will be confining our discussion to mutations that change nucleotide sequences and also making predictions on that subject as well.
The evolutionary rate of speciation is derived from the distribution of branching events in a phylogeny (Pagel et al 2006), and differences in the net diversification rate are estimated by comparing the number of extant species per lineage (Bromham et al 2015). Another problem with these phylogenetic measures of diversification rates do not map to the process being considered in speciation models. The CHM model suggests that genetic drift and recombination are the main drivers of speciation and diversity and occurs rapidly.
Phylogenetic estimates of diversification are not actually direct measures of time to reach reproductive isolation as predicted by studies on speciation (Wiens 2004). It’s even been discovered that previously isolated populations can also rejoin and fuse after they had already speciated (Coyne and Orr 2004), and physically or spatially distinct forms may actually be connected by interbreeding populations (Irwin et al 2001). These factors are overlooked in phylogenetic mutation rates.
Synonymous mutations are point mutations, meaning they are just a miscopied DNA nucleotide that only changes a single base pair. For a mutation to be detected as a consistent difference in the DNA sequences sampled from different animal populations, it must clear several hurdles. First, if a new mutation arises it then must be copied from the genome it occurred in (parent) and passed on to that individual’s offspring (child), in order to enter a new generation. If the newly arising mutation is included in one or more offspring in the next generation, then each of those individuals has a chance to reproduce and pass the mutation to their offspring. While the mutation is new and at low frequency in the population and depending on the population size. There is a chance of the mutation being lost by chance if those few individuals fail to reproduce. If it increases in representation in the population, the mutation becomes established as a polymorphism, carried by some but not all members of the population. Eventually, it may rise in frequency until it replaces all other variants in the population, so now all new individuals born in that population will carry a copy of that mutation. At this point, we call the mutation a substitution and say that it has been fixed in the population. So a point mutation can make its way through the population, and depending on the population size and growth rate will determine the substitution rate. This is why pedigree studies are so important, as they can catch newly arising mutations, and since selection has no effect on the region then it ultimately is the best way to determine a species age. Overall the rate of mutation is what we need to focus on because this will determine the mutation rate clock per species and is a much better indicator of time than substitution rates because population size can change over time. Effective population size does not have a significant effect on the neutral substitution rate. Only the rate at which fixation is reached. This brings me to the region of the mitochondria I will be focusing on, the Cytochrome c oxidase I (Co1) gene fragment. Since out of all regions in the mitochondria this is the highest conserved of them all.
The Co1 gene fragment is a segment of the mitochondrial that is 658 base pairs (bp) long in all life (longer in some). It is going to be the focus of my predictions and the focal point of discussion from this point on. The sequence of this region is often referred to as “DNA barcode” (Ratnasingham and Hebert 2003 & 2013). DNA barcoding is based on the premise that Co1 sequence divergence is higher between species than within species (Hebert, Ratnasingham & DeWaard, 2003). Thus far all Co1 gene studies regarding mutation rates come from fossil record based calibrations on the geologically oldest fossils (Peter B Marko 2002).
The reason I am focusing my attention on the Co1 gene is the fact that it is highly conserved across all species, it non-recombining, a bottleneck would entirely reset this region, all mutations that do arise are neutral therefore selection doesn’t alter the region and the gene itself is part of the mitochondria - which itself mutates fast and clear rates of change can be observed in real-time rather than mere ad hoc speculation.
Differences in the Co1 gene are all point mutations that just change a single nucleotide sequence of a gene, not the amino acid sequence it codes for. All mutations that occur in the Co1 gene are Point mutations. Point mutations arise when damage to DNA is imperfectly repaired or errors in DNA replication are not fully corrected, resulting in a new permanent change to the base sequence such that the changed sequence will be included in any subsequent copies. The probability of a point mutation being passed to future generations is entirely due to reproductive availability, so its frequency in the population is determined only by the mutation rate and the effective population size. Take a rapidly mutating genome of accumulating point mutations and add it to a small population with a fast generation time and the frequency is increased. Give that same point mutation rate to an already large and growing population and its frequency becomes low. This is why some populations have more and others less diversity. Take humans of the same family and culture with identical rates of point mutations and place half in a large population and isolate the other half. After a few short generations, the rates will have changed, as point mutations will reach fixation much faster in the smaller isolated population, especially since inbreeding will occur. This is what determines what gives the appearance of a younger or older, more diverse or less diverse people group after many decades. This is an example of one of the many factors one must consider when not only looking at mutation rates but also at the different diversity we find in nature and within even related populations, not just between species.
Overall in all life, the rate of new mutations arising is faster than predicted by evolutionary standards and this is one way we know that a bottleneck must have occurred. Especially since all life tested still has extremely low levels of mutational change, yet rates are fast throughout all animal mitochondria as you will soon discover.
As stated, the Co1 region has shown to be highly conserved and mutations that occur there are always synonymous. Meaning that all mutations that arise in this region are never altered by selection, which can theoretically affect other regions of the mitochondria, altering their true clock overtime. This is extremely important since these types of mutations are neutral single synonymous substitutions, meaning selection cannot see them and their rate of evolutionary change will be equal to the true mutation rate. This means that the minimal amount of variation we see in all life when looking at the Co1 gene, all occurred from "neutral" mutations that arose after a bottleneck. In other words, these mutations are all new and they are irrelevant in terms of the natural and sexual drivers of change. How similar or not these "neutral" mutations are to each other is like tree rings, they reveal the approximate age of a species. Since all Co1 differences within and among closely related animal species are always and always will be synonymous, the region becomes the ultimate testing grounds for finding a true mutation rate. Again this means that all the observed changes are non-selectable and neutral compared to non-synonymous substitutions (Kocher TD et al 1989; Kerr KCR 2011). This makes the mutations that accumulate within the region perfect for also making predictions based on, unlike other regions of the mitochondria where there is a chance that selection and drift can have an effect. If it is validated that this region ticks fast, as opposed to the slow evolutionary assumption rate based on the fossil record. Then it is a 100% falsification of deep time evolution and confirmation of the YEC timeline.
A uniformly low variation in bird populations from a few thousand in number up to several hundred million has shown us that just like humans, whose population is in the billions. That genetic diversity within their species remains extremely low. How can this be if humans have a similar mutation rate to primates, yet they do not have low variation within their populations? This data tells us that the faster a particular species grows in population size and expands across the world, the fewer mutations get passed between the population and the more rare substitutions are able to reach fixation. This causes less diversity within the species to be visible even though the species are the same age.
The best way to explain it would be comparing chimpanzees to humans who have similar mutation rates, yet the amount of total nucleotide substitutions within the chimps Co1 gene ranges from around 65 base pair differences on average. However, humans only have 10 point mutation differences maximum, since we have expanded and grown so fast as a population from this last bottleneck. On average, chimpanzee sequences contained 28.8 non-synonymous differences when compared with 8.91 observed in humans (Anne C. Stone et al 2010). Substitutions only were able to rise to fixation only early on in humans, during the three bottlenecks in the recent past (Creation, Flood, Babel), and each time the population exploded afterward. This makes new mutations much harder to reach fixation in today’s population in the billions, but still relatively easy in primates whose populations are always in the thousands. In regards to other primates, fixation kept occurring constantly and faster since they do not migrate nor expand in population size as humans do. Their population numbers always remain small, allowing for more diversity within the species as fixation is reached much quicker. Evolutionists Interpret these higher amounts of differences as evidence of deep time because they start with their conclusion and work backward. It’s the paradigm driving the Interpretation and conclusion.
I hypothesize that all species are adapting rapidly, continuously, and at fast but slightly different rates from one another for different variables. This is why obtaining an empirical Co1 mutation rate in different creatures even within the same family is so important. We still observe diversity continuing to rise today, thus synonymous point mutations in the Co1 region are still occurring. Meaning that saturation in this region has not yet occurred and has not been equilibrium reached.
Another way to know that mutation saturation has not yet occurred is by comparing this gene in the mtDNA to the entire mitochondria itself. Given that the total mtDNA is 16,569 base pairs in total. Dr. Jeanson regarding this mutation accumulation in his own study states: “If the individuals in this study had mutated to saturation such that every DNA position had been mutated, then the DNA identity between them should have been no different than a random alignment of DNA sequences. Since every position in a DNA sequence has four possibilities due to the four bases—A, T, G, C—in the DNA code, a random alignment matches 25% of the time by chance and mismatches 75% of the time. None of the comparisons in this study even came close to 25% identity. The lowest match was 86%—far in excess of 25%.”
In other words, if the mtDNA genome was mutationally saturated, then all-new mutations would be invisible as they would simply affect already mutated regions. If deep time were true, that is what we would expect to find and we would be unable to see newly arising mutations outside of the already currently mutated regions. Since this is not the case, we can be certain that equilibrium has not yet been reached and we are looking at a young genome and inevitably a recent bottleneck. A comparison of human and chimpanzee entire mtDNA reveals the two mtDNA genomes are far from mutational saturation – the 1,483 differences represent just 9% of the total human mtDNA genome length.
So if 12,000 mutations are what it takes to reach equilibrium, spread evenly over the entire mitochondria. Then this means a 12,000 mutation saturation point out of 16,569 equals 72.72% of the region allowing mutations to accumulate before they simply start to turn over already mutated regions, establishing equilibrium in the mtDNA. The sequence simply won’t become more or less similar after this point. Extrapolating this 72% in the Co1 region of just 658 base pairs means that 473.76 changes would have to occur before equilibrium is also reached. Nothing in nature is nowhere near this, just as there is nothing in nature near 12,000 in the entire mitochondria length. The entire Canis genus (Wolf, Jackal) combined not a single species has been found to have about 123 mutations Nothing above that, in the entire canid kind. Similarly, all Felidae also have a low amount of mutations accumulated. 118 nucleotide differences is the maximum found in any cat species. This means there is still room for another possible 355 mutations in this region before equilibrium is reached. Since selection is not playing a factor in the Co1 gene and removing possible mutations, then this is even stronger evidence of a young genome than even the entire mitochondria.
Since selection is not altering mutations in this region, powerful predictions on mutation rates can be made. And with them, we can also explain the pattern of diversity we see in nature today from a YEC perspective. Yes, unique patterns can still periodically arise, but this has only resulted from either interbreeding or when hybrid species cross with older more stable species. These unusual patterns in no way undermine the strength of DNA barcoding in any way. Barcoding will continue to deliver species-level resolution in 95% to 97% of all cases (Janzen et al 2005; Hebert et al 2004; Ward et al2005). This makes it extremely accurate and in my opinion, the overall best region of the mitochondria for testing and making predictions.
A universally selection-driven mtDNA clock tells us that based on the evolutionary theory that all organisms are mutating at about the same rate, this is the popular “Neutral theory”. The neutral theory posits that sequence differences within and among species are selectively neutral, so they are invisible to both adaptive and purifying selection based on generation time alone “generation-time effect”. However, the new data looking at the Co1 gene has been shown to contradict the key predictions of neutral theory, specifically, universal limited intraspecific variation and a universally similar molecular clock in all life. What we actually see is that some species with slow generation times can have more diversity than species with fast generation times. Take for instance the sea snail Echinolittorina. With a generation time of just 2 years on average, they have less diversity than a gorilla who has a generation time of 19 years, and supposedly evolved much earlier. Another example is that of different aquatic life forms. When comparing the generation times of invertebrates ranging from 8 days in the small hydrozoa freshwater animal species Hydra magnipapillata to the generation time of Sea snails species M. neritoides at 1,250 days. Evolution would predict that the M. neritoides mtDNA mutation rate would be on the lower side with less diversity. Yet, M. neritoides has more diversity and higher mtDNA mutation rates that do not fall within the range of mutation rates of other invertebrates with longer generation times than M. neritoides, i.e., from the boulder star coral species Montastraea annularis and the purple sea star Pisaster ochraceus. Since invertebrates with shorter generation times are always supposed to have higher mtDNA mutation rates since their mitochondrial genomes are copied more frequently (Thomas et al 2010). This makes no sense evolutionary and is contradictory to the neutral theory. Clearly, a universal generation time-based clock fails to explain this and many other patterns we find throughout nature. This is why predictions must be made regarding mutation rates, and observable pedigree studies are without a doubt the most optimal for this. As of now, the Co1 gene is only used to identify related species to one another. An empirical mutation rate is not paramount, so no one is testing this region for a mutation rate.
We will be investigating the effects of multiple theories that alter the molecular clock and determine which one if any, some or all play a role. With the metabolic rate hypothesis, we expect faster-reproducing organisms with higher metabolic rates, such as mice, compared to larger-bodied mammals like humans and whales, to have similarly higher mutation rates. This holds true for most cases, but not all. If a fast metabolism alone promotes faster mutation rates, then endotherms are predicted to have more rapid mutation rates than ectotherms. Such patterns are frequently reported, adding credence to the theory (Bowen, Nelson & Avise 1993; Thomas & Beckenbach 1989; Adachi, Cao & Hasegawa 1993; Avise et al 1992; Martin & Palumbi 1993). Where this hypothesis breaks down are birds, as avian metabolic rates are higher than those of mammals, but they have slower rates of molecular change (Prager et al 1974). There is also the problem with humans and great apes as well when using only the metabolic rate hypothesis. Humans have a much higher metabolic rate than any primate, yet our mutation rate is slower (Herman Pontzer et al 2016). This is best explained in how long we humans as a species live and the larger a generation time we have. Then there are also environmental conditions to account for, especially temperature. For example in recent years bird numbers and diversity declined dramatically. Until now, researchers have often assumed climate changes challenge mammals and birds in similar ways, because both need to maintain their body temperature. The energetic costs of cooling in birds were more than three times higher than in mammals.(Eric Riddell et al 2019). It was found that mammals do far better in warmer climate conditions and diversity increases more in these conditions. Also explain why Africans also have more mutation differences. So while I expect diversity to increase in all life, I expect birds to show the least amount of change because of current global temperatures. So clearly to make predictions on mutation rates within a wide variety of different species in different environments. Other factors besides mere generation time are valuable factors of consideration in obtaining an accurate mutation rate. The discrepancies in evolutionary Neutral theory are remedied by combining the Created Heterozygosity Model with the metabolic rate hypothesis with the generation time hypothesis for optimal results. Though other factors contribute, the main focus is that of predictions and results from historical ages that flow from these.
I should point out that just because intraspecific Co1 barcode variation is uniformly low regardless of census population size no matter where we look (Thaler 2018). This does not mean that all life is mutating at exactly the same rate, it simply means that the bottleneck was much more recent in history than we have assumed and mutation rates are also much faster than predicted by evolutionary standards. It also does not preclude the many alternative hypotheses to explain the pattern of diversity we see. Sequence differences remain neutral within “related animal kinds” even after new species are formed. This allows us to know what is more related to one species over another. It also shows us that a fairly constant mutation rate within the individual species is similar as well. This makes predictions possible, with high accuracy. Of course there will always be random outliers from things such as isolation and inbreeding. But an overall rate can still be obtained and variables accounted for. The discovery of universally low intraspecific variation contradicts a central prediction of neutral theory and is not readily accounted for by commonly proposed explanatory modifications.
Now we get into Hominidae Co1 gene mutation rate predictions.
The average generation age for humans in tribal societies was 29 years old in over 500 different societies tested.

Once I obtained the average (29) I then took the upper and lower generation limit - 22 and upper 35 years as my minimum and maximum range to make predictions.
Humans are not like animals in regards to the flood. It tells us that Noah brought his three sons and their wives. This is 3 different mitochondrial lines, so I will be making my human mutate rate prediction going back to creation. As for animals, it tells us they were bottle-necked down to a single pair (Genesis 6:19-20)–“And of every living thing of all flesh, you shall bring two of every kind into the ark, to keep them alive with you; they shall be male and female.”
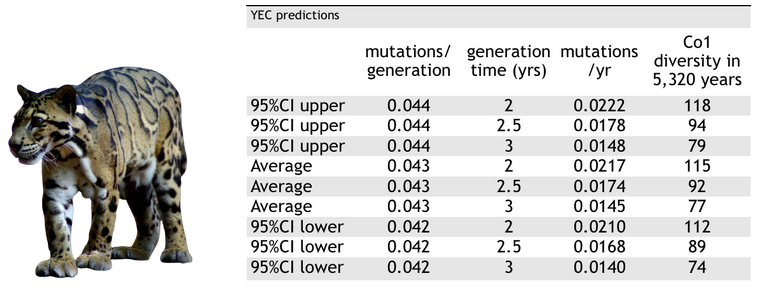
Therefore using the date of creation 7,576 years ago. I predict humans will mutate at a rate of 0.0095 average (95%CI low 0.0014, High 0.0194) mutations per year in the Co1 gene.

Humans today have an Average Pairwise Difference (APD) of just 0.2%, between 0.1% - 0.3%. The majority of people share just a few nucleotide sequence differences. Since humans have explosive birth rates and rise in populations fast, few mutations become fixed and few point mutations get shared between all people groups. This is why we find so few within humans, yet far more in primates who have similar but not identical mutation rates.
There are greater differences among populations of modern chimpanzees, gorillas and orangutans than among modern humans. This is why even with a fast mutation rate, few differences are found as human population growth is rapid and it also explains why smaller populations of people in Africa have more differences than the rest of the world.
This low genetic similarity between all humans refrects three things; 1:), We all went through a recent bottleneck in the past. 2:) We exploded in population growth after this worldwide bottleneck which kept differences between humans low. 3:) Animals were reduced to a single pair during the flood bottleneck which was a mitochondria restart for all life at that time except humans, which we can see was Noah and his 3 sons and daughter in law. We see their 3 separate haplogroups today, validating this hypothesis. Since humans only go back a few thousand years till creation and all animals went through this recent bottleneck it explains why all life has low APD’s.
Using evolutionary phylogenetic assumption, it is believed that 50,000 years ago is the origin for non-African people groups diverged out of Africa (Bowler et al. 2003; Henn et al 2012, Poznik et al. 2013, Mellars et al. 2013; Higham et al. 2014; Lippold et al. 2014, Karmin 2015, Posth et al 2016). This means if humans really had remained in Africa in small groups for over 150,000 years, they would have far more fixed substitutions than just the 24 we see and the 8-10 mutations in the C01 gene at the highest end. Clearly all the genetic evidence tells us humanity is young and so is all animal life.
Remember evolution predicted and tells us that genetic variation is supposed to increase within a species as a whole due to selection for particular alleles in certain environments and/or from reproductive isolation. In either case, the prediction is a relative increase in variance within the modern human species compared to other animal species and a multimodal distribution of that variation in modern humans. While more fixed substitutions were found in Neanderthal and Denisovan who were both isolated and inbred, we expect this.. Yet modern day people that kept spreading out and growing in population size explains the low diversity we now see in humans but not in any primates .
So since genetic differences are supposed to go up within a species group as a whole due to selection for specific alleles in a particular environment. “Different geographic populations, subspecies, or races imply that the amount of variation in the species would be relatively large or that total variation would have discontinuous features (Templeton 2013).” Yet humans do not follow this rule because we live in the most diverse environments on Earth having many different selective pressures and also have large varying generational age gaps, including vastly different social structures while constantly growing in population size and migrating. This is why we have the lowest genetic diversity compared to primates. They admit that “it is peculiar that human genetic variation is so unique and is also controversial” (Fuentes 2012; Shiao et al. 2012; Templeton 2013; Fujimura et al. 2014; Yudell et al. 2016).
Mitochondrial inheritance is uni-parental and the entire mitochondrial genome forms a single “take it or leave it” linkage group (Neher 2013). This means that Noah’s flood that only lasted for a single generation and had only two pairs on the ark reset mitochondria diversity. Because genetic drift acts more quickly to reduce genetic variation in populations, undergoing a bottleneck can reduce a population's genetic variation by a lot, even if the bottleneck doesn't last for very many generations. The humans on the ark however had 3 separate mtDNA lines, therefore we can track back further to Eve, whereas there was only a single Y chromosome line on the Ark (Noah’s). This is why we can track the Y chromosome to Noah and not Adam.
Now for another important question. How do all primates have 60-105bp differences over this short time frame? Well gorillas and chimps not only remain isolated and often inbreed but also do not migrate over the globe like humans. They also have lower generational times and much shorter lifespans. All of these factors make diversity go up faster. They even begrudgingly admit that this makes sense.

Here is the big question evolutionists need to ask themselves. If they acknowledge that higher diversity is consistent with reproductive isolated groups. Then why do they deny that Neanderthal and Denisovan who were both isolated and inbreed would not have higher diversity because of those reasons? Clearly they would, as they have literally just admitted, and that is exactly what we see and what our model says happened.
Clearly the mutation rate in this region is faster than expected in the evolutionary model. The reason there is more diversity with them and not us is because of their faster mutation rate driven by generation time, isolation, inbreeding, warmer climate location, lack of migration and they also speciate.
Some are starting to notice mutational hyperdiversity is a lot more common than previously thought....

Chimpanzee (pan troglodytes).
First, what is the generation time for wild chimpanzees (pan troglodytes)? I found two good studies on wild primates. They both have close agreement, so I used both.

The average pairwise difference WITHIN each species is the 0% to 0.5% with an average APD of 0.2%. The most available data is for modern humans, who have an APD of 0.012% between all humans.. All chimpanzee species are closely related but very diverse with a APD range of 0.06%-0.2% differences between them all.
While the nucleotide differences between us and chimpanzee’s is about 60-65. This makes us extremely different from any primate in relation. From an evolutionary perspective this is just a variance dependent on deep time. Yet they can not make any predictions regarding this, so they have little confidence in the theory. I predict that the Co1 gene mutation rate will confirm the global flood occured about 5,320 years ago.
For the wild chimpanzee I predict a mutation rate per generation of 0.2937 (95%CI lower 0.2935, upper 0.2939). This prediction is based on the chimpanzee being a species that was on the Ark.

This is a 0.0084 nucleotide substitutions per year average with a maximum rate of 0.0127.
With my mutation rate, we could see an increase in maximum diversity as often as 68 years within the pan troglodytes species with an average increase as a whole every 116 years. Now if evolution was true, remember it takes 1 million years to get 40 nucleotide changes per 1,000 base pair. So in the Co1 gene fragment which is 648 base pairs in size, the math is done by taking 1,000,000 yrs and the changes would be 648/1000 x 40 = 25.9. This is how many changes would occur over 1,000,000 million years according to the evolutionary model.
Therefore the average single nucleotide chance would be every 39,000 years. This is 5.13 nucleotide changes every 200,000 years. The two models regarding mutation rates are off by an order of magnitude. Using my mutation rate and placing it on the evolutionary bottleneck 200,000 years ago the results show the contrast between models.

If the evolutionary timeline were true, chimps would have at minimum 975 nucleotide substitutions over time based on my mutation rate. We see nowhere near this, but rather mutation rates consistent with YEC.
Gorilla
I again found two separate studies that gave generation times of wild Western gorillas. They resulted in a close match, so I combined them. I used the low and high average of one study (18.2 years and 20.4 years) and the middle average of the other (19.28 years) since they were both so close. Also keep in mind female mountain gorillas give birth to one baby every 4 years.

My prediction on the Gorilla mutations rate per generation; 0.261 (95% CI Low 0.26, high 0.2615).

Pongo Abelii
Next we have the Bornean Orangutan. This primate begins to reach sexual maturity as early as 9 years of age, but does not have their offspring till 15-16 years of age. They wait 3-4 years between offspring and usually just have 1, sometimes 2.
I predict the Abelii Orangutan mutations rate per generation; 0.272 (95% CI Low 0.261, high 0.2834).

Pongo Pygmaeus
Next we have the Sumatran Orangutan. This primate has an even faster generation time as they can reach sexual maturity by 6 years of age and usually have their first offspring at 11.1 years of age.
I predict the Abelii Orangutan mutations rate per generation; 0.272 (95% CI Low 0.261, high 0.2834).

As you can see I predicted this species to arise later from Pongo Abelii. There are 50 differences between the 2 species, and this mutation rate and time-frame answers that.
You may have noticed species have differences in mutation rates per generation. As I explained earlier, evolutionists believe that differences represent deep time. To them more differences mean the farther back a species goes in time, the older it is. The reality is that mutation rates go right back to the same time just thousands of years ago and differences are based on many factors depending on the organism.
Canis Lupus
A wild wolf generation study was done in Superior National Forest (SNF) and Minnesota (MN) discovered a range from 4.3-4.7 years. (L. David Mech et al 2016). In the SNF, proportions of currently breeding females (those breeding in the year sampled) ranged from 19% at age 2 to 80% at age 5. In (MN) wolves range from 33% at age 2 to 100% at age 7. Sometimes social interactions delay many from reproducing until 5-6 years. Wolves have a lifespan of up to around 8 years in the wild. There are a total of 38 subspecies of gray wolf worldwide, a number of them have gone extinct. We will use the mean average of both wild wolves tested in SNF and MN for a 4.5 average generation time. Basal metabolic rate (BMR) also matters, and a species size can dictate metabolism (Brown et al 2004) including some other factors. The BMR was measured in 12 gray wolves (Canis lupus) (x̄ body wt = 33.0 kg) in winter. The BMR averaged 8.08 liters O2/hour; resting metabolic rate after feeding was about 45% higher (H. Okarma et al). On the basis of BMR and daily food consumption (DFC), it was calculated that an average wolf (35 kg) needs 13,421 calories daily, which corresponds to 1·74 kg of prey biomass. Calculations based on field metabolism rate yielded a 60% higher value, i.e. 2·77 kg of meat per day (Zbigniew Głowaciński et al 1997). Since changing of temperature affects body size and metabolic rate and different environments affect wolves worldwide, we have to use a baseline average. Therefore with a lifespan of 8 years, with an average size of 58.6 lbs. With a Typical body temperature of 38.3ºC or 100.9ºF and an average speciation event every 140 years. We see a correlation between metabolic rate and generation time. Therefore I predict the Canis Lupus Mutation rate per generation to be 0.0655 (95% CI Low 0.04, High 0.091).

Of course, some wolves in the arctic may be larger to help with cold and have a slower metabolic rate, while wolves near the equator tend to be smaller with faster metabolisms. But the mutation rate should equal out as an average. With the current predicted mutation rate, we expect to see additional nucleotide substitutions occur every 60 years within the Canis Lupus species on average. Diversity will continue to rise within the wolf kind with a high-end rate of diversity in wolves increasing every 47.5 years. As of now, the maximum number of mutations discovered within the species is 112. This is the maximum diversity found and this number will continue to climb every 5 decades based on the YEC model.
Using this fast mutation rate and placing it on an evolutionary bottleneck 200,000 years ago, the results show the striking contrast between models.

If the evolutionary timeline were true, wolves would have at minimum of 1,702 nucleotide substitutions over time based on my mutation rate. We see nowhere near this.
Next, we have the Sechuran fox aka Peruvian desert fox (Lycalopex sechurae). Other than the fact that the young are born in October, nothing is known about their social life or breeding habits. There are also no recognized subspecies either. Their gestation period, size of litter, age at sexual maturity, and longevity are all unknown. Their lifespan is very short, probably because they are the smallest of the genus (8.8lbs). One captive animal was documented to live 9.9 years (Richard Weigl 2005). The Sechuran fox is nocturnal, and they can live on seed pods, fruit and are capable of surviving on an entirely herbivorous diet when necessary. They live in a warm climate year-round ranging 62°F to 82°F in southwestern Ecuador and western Peru, at elevations from sea level to at least 1,000 meters. These many unknown variables make a prediction harder. Considering their short life, and the fact that Argentine gray fox “Lycalopex griseus” a South American gray fox species closely related to the Peruvian desert fox has a generation time of 1 year. I will assume theirs is close to that. I suspect the arrival of this species was also much later after the bottleneck since migration had already brought the parent species to South America then speciation occurred. So I will also place this date around 4,500 years ago based on the post-flood ice age migration diversity. I predict a basal metabolic rate of around 5.5000W / body mass 2744.2 g / 0.002004 W/g. We see correlation with generation time, and metabolic rate again. Therefore I predict the mutation rate per generation at 0.0202 (95%CI low 0.020, high 0.0204)

This means that this species has a fast mutation rate of an average overall increase of one new mutation within the species every 50.5 years. I expect diversity to increase within the species as mutations continue to arise and we will see the average go up from its current 105.44 nucleotide mutations (2020). On the high end, I predict maximum diversity to increase as often as every 45 years. This means the most diverse of the Peruvian desert foxes today will increase from 118 nucleotide differences to 119, then 120, etc… every 45 years, considering this lineage with the highest diversity continues living and passing on their mutations.
The Tibetan Corsac Fox (Vulpes ferrilata). This fox lives up to 13 years and reaches sexual maturity within 9-10 months (ADW) but reproduction does not start till the second year of life. The mating season starts in January and ends in March (Ovsyanikov, N. 2004). They weigh 2,700 g or 5.95 lbs. With only three subspecies, these foxes inhabit open grassy steppes and semi-deserts, while avoiding dense vegetation, mountainous regions, deserts with drifting sands and snowfields more than about 15 cm (6 in) deep. This makes the species more metabolically stable with a predicted metabolic rate of around 5.000 W / 2698.8 g / 0.001852 W/g. Again we see correlation with generation time, and metabolic rate again and since they do not speciate often if at all. It is much easier for predictions as speciation enhances rates. Therefore I predict the mutation rate per generation is 0.027 (95%CI low 0.024, high 0.030).

The maned wolf is a large canine of South America. It is the only species in the genus Chrysocyon (meaning "golden dog"). The life span of maned wolves in the wild is unknown. They weigh around 47 lbs and the max life expectancy is 15 years. The average age at reproductive maturity is 2 years according to https://animaldiversity.org/. With these numbers to go off and its location and lifespan, I predict an average mutation rate of 0.0189 per generation (95% CI low 0.0178, high 0.020). This means an average diversity increase via substitution every 53.2 years.

Another logical conclusion and conundrum for evolution would be differences between current domesticated dog breeds who have had little time to amass many differences within the species and between species. Yet between wolves and domestic dogs, there are 28.83 nucleotide differences. So if wolves obtain an average of 1 nucleotide difference in 60 years. Then for the Tibetan Mastiff which is 29 differences away from the wolf and assuming the mutation rate is near the same as the wolf. We are looking at around 1,740 years to obtain the average differences we observe today separating the two species. This easily explains the diversity we see between the two species Tibetan mastiff and the wild wolf.
This breed has been documented going back to the Qing dynasty, the last imperial dynasty of China. Which was established in 1636 and ruled China proper from 1644 to 1912.

Now let’s look at the cat "kind."
Neofelis
Regarding the mutation rate of wild cats, there is a wide range of diversity within the species but overall very low like all animal life. All cats descended from a single cat “kind” that was on board the Ark. Based on the Biblical timeline and no way to know what cat species was on the Ark. I will be choosing the closest one I can, the Sunda clouded leopard “Neofelis diardi”. With a weight between 28-43 lbs, max lifespan of 19.8 years, generation time of 2 -3 years of age and have anywhere between 1 to 5 cubs, with an average of 2 cubs per litter and a 12 to 15 years lifespan. No information on metabolism is available so I will assume it on cats of similar weight, body type, lifespan and environment (Metabolic rate per body mass 30.0000 W, 0.001423 W/g.) This cat is separated from the panthera leo by 82 base pairs (bp) differences, from the Panthera tigris by 84 bp and from the panthera onca by 79 bp.
These cats are poached very heavily and their habitat is dwindling. They have been listed as Vulnerable on the IUCN Red List since 2015, as the total effective population probably consists of fewer than 10,000 mature individuals, with a decreasing population trend. Obviously diversity will be much harder to predict as they are in decline, therefore I predict for both the Neofelis diardi and Neofelis nebulosa species an average mutation per year 0.032 (95%CI low 0.022, high 0.042)
Panthera tigris
Panthera tigris is one of the many that species branched off with others during speciation after the ark had already landed and animals began migration.

Panthera tigris was not on the Ark but formed later. With a typical body mass of 264 lbs (137900.0 g) and a body temperature of 37.5ºC or 99.5ºF with average basal metabolic rate of 133.8590 W, you get a metabolic rate per body mass 0.000971 W/g. Lifespan up to 26 years. Tigers have the slowest metabolic rate out of all cat’s, twice as slow as a cheetah. Stacked with their high generation time, this causes them to have the slowest mutation rate of all cat species. All tigers fall within an ADP of 0.47% between all tigers.
With an average generation times of 1,268 days in females and 1,415 days in males with an average generation time in days being 1,341.5 days, or years converted to days equalling 3.67305. I predict the mutation rate per generation will be 0.065 (95%CI low 0.064, high 0.066).

I predict the average substitution change will raise diversity within the species every 56 years and at the high end every 50.6 years we could see the peak diversity rise.
Lion (Panthera leo)
There have been contrasting estimates of generation time for lions (Bauer, H., Packer, C., Funston, P.F., Henschel, P. & Nowell, K. 2016). A common theme of 4 -5 years is the most consistent with other previous demographic estimates in the wild 20105.
With a typical body mass of 386 lbs (175,000 g) and a temperature of 37.9ºC or 100.2ºF with a basal metabolic rate of 94.5800 W, you get a metabolic rate per body mass 0.000965 W/g and a Lifespan up to 27 years. With an APD of 0.71%, these factors give me the power I need to make predictions on mutation rates compared to related cats.
I predict a mutation rate per generation of 0.0564 (95% low 0.0552, high 00.0566)

I predict that within the lion species, a substitution change will arise once every 65 years on average with a high rate of one new mutation every 53 years .We will see diversity continue to go up.
So with my mutation rate prediction, I will show how all things line up, giving us an overview of time, how new species arose and the differences obtained over time within and between them. For example with my mutation rate we see 73 nucleotide differences between the tiger and the jaguar yet only 58 between the lion and the tiger since they separated closer to one another. We can see the clear trajectory, and even base predictions off of this as well. For example the next nucleotide change we will see between the lion and tiger will be every 87 years, whereas every 63 years between the tiger and jaguar.
Now the question regarding Ancient Egypt and felines. When did cat domestication begin? What wild cats were involved and when did this happen? If this was recent, does this prove that nucleotide changes happen faster than evolution assumed? So many questions, let’s answer them and make some predictions.

Two wild cat species existed at this time to manipulate breeding for domestication.
Felis chaus is the first cat we will look at. We find small-bodied mammal species tend to have faster rates of molecular clocks than their larger relatives (Martin & Palumbi 1993). A generation time of 11-18 months with a possible 15-year lifespan in the wild for these cats.
I predict the mutation rate will be an average per generation mutation rate of 0.0189 (95%CI low 0.0187, high 0.019). This is an average mutation rate of 0.0158 nucleotide substitutions per year.

I predict the average substitution change will occur within the species every 63 years on average and at the high end every 48 years. Observable diversity will continue to rise.
The African wildcat (F. silvestris).
Their age at sexual or reproductive maturity male and female 9 to 12 months and give birth to 1 to 8 young. They live up to 16 years in the wild. I predict the mutation rate will be an average per generation of 0.0141 (95%CI low 0.0139, high 0.0143). This is an average mutation rate of 0.0171 nucleotide substitutions per year.

The average nucleotide change within the species will continue to raise diversity within the species every 71 years. With a high-end rate of change of 52.7 years.
These two cats were crossed and created the early breeds of Egyptian domesticated cats used for pest control named Egyptian Maus (Felis silvestris lybica). “Mau” is the Egyptian word for cat. The Egyptian Mau is the only naturally spotted domestic cat. They live for about 15 years and have a generation time of 8 to 10 months of age.

It was the two cats I mentioned above, the Felis catus and wild cat Felis Silvestris lybica that were crossed to breed into existence the first domestic cat, “the Manu” during the Middle Kingdom.

With a Typical body temp of 38.1ºC or 100.6ºF and a predicted Basal metabolic rate of 5.0000 W and a body weight of 3,900 g or 8.6 lbs. I predict a Metabolic rate per body mass 0.00050 W/g. Making these small cats have a faster metabolism than most all other cat species. And a rate of mutation higher than lions and tigers and bears oh my!
I predict diversity within domesticated cats “Felis catus” to continue to rise beyond its highest current maximum diversity of 101 mutations every 39 years. With an average rate of diversity increase within the Felis catus every 49 years. This is a rate of change of 0.0162 mutations per year average. This rate of rapid mutation explains why lions are 82 base pairs separated from felis catus. All cats range within just an APD of just 0.002% - 0.18%. Felis catus makes a good cat species for predictions because their numbers are more stable. As where cheetahs are inbred and dying out, so an accurate mutation rate would be hard to pin down since they may not even exist in 50 years.
As we now know, a global bottleneck was required to reset all animal mitochondria. I propose that this was a much more recent global event that reduced the genetic diversity in all living creatures’ mtDNA. Meaning these numbers we are looking at in terms of mutation diversity, all arose after this time and rapidly. If true, evolution has a contradiction on its hands and now has to account for the diverse patterns we see including the low genetic diversity we now see without ad hoc evolutionary presuppositions.
Evolutionists invoke slow mutation accumulation over hundreds of thousands of years to account for the genetic diversity we see. While on the alternative side, we can easily explain the diversity of the canis, vulpes, sea snails, and feline species within a short timeframe. Ponder this… According to Animal Planet, “The cat fancy as we know it today began in 1871 when the first modern-day type of cat show was held in London's Crystal Palace. At that show, 170 cats were exhibited. More than half of the breeds recognized by our cat associations have existed for less than 50 years.” So if we can generate over 85 cat breeds in under 50 years and observe genetic diversity increase via mutation in this short timeframe. What makes YEC proponents believe that it takes hundreds of thousands of years for these mutations to build up, yet we can see diversity increasing still today in modern-day domesticated animal breeds that are new arrivals. Also, when arguing against fast speciation rates, why do they imply that it is impossible for only a few wild cat species to arise via speciation over just a couple of thousands of years’ time? Especially since we can observe how fast it occurs today in real-time through breeding including observable studies on wild species? In both cases it’s not, that is your answer. An empty world for animals to migrate freely and speciate as needed only accelerated this process post flood.
Clearly, it doesn't take millions of years to form a few cat species, just like it has been discovered that it doesn't take 3,000 years for Darwin's finches to species but rather only 3 years (Fan Han et al 2018). Completely contradictory to what Darwin predicted based on evolutionary assumptions. So if speciation occurs quickly, mutation rates are fast, a recent bottleneck occurred, predictions can be made based on YEC that can both explain the pattern of diversity we see and mutation accumulation only goes back a few thousand years. Then we are looking at the clear evidence that falsifies evolution in multiple ways.
Here is the confirmation regarding these mutation differences being fast in my eyes. They admit cat domestication is no older than 4,000 years and is attributed to the Egyptians. Since the Egyptians documented everything and in great detail. We find only a handful of textual mentions regarding cats of any kind during the old kingdom period (2,663-2,195 BC). Then in the middle Kingdom (2,066-1,650BC), domestic cats became common in text and images including contexts that are clearly indicative of domestication (for example Neferronpet Kenro of 1,250 BC tomb.) The first-ever indication of a mummified cat dated 1,350 BC, assumed to be Prince Thutmose’s pet (Ikram et al 2002).
So with documented sources of cat domestication of Felis catus going back only 4,000 years maximum. This evidence from a YEC perspective is the only way to explain why modern house cats have more mutation differences than lions and tigers over such a short period of time. If evolution were true and big cats that have supposedly existed for millions of years (Brian David et al 2010), and it is believed by scientists currency that big cat and small cat lineages diverged from a common ancestor about 11.5 million years ago, with the big cat lineage splitting off first (6.5–15.3) MYA into the genera Panthera (lion, tiger, jaguar, and leopard). Followed by small cats (5.1–13.5) MYA into the genera Lynx (lynx, bobcat), Felis; including domestic cat, Geoffroy’s cat and Andean mountain cat (Donald W. Duszynski et al 2018). Is used as evidence of why so few mutations exist and why so few mutations are different between small and large cats based on neutral theory. The only problem with that is some large cats have more mutations than smaller cats like servals, ocelot’s, and all species of Prionailurus, a small wild cat. While other small cat species have more mutations like lynx, puma, mountain lion, and felis cactus. These clear contradictions show us that neutral theory fails in its explanatory . These types of discrepancies are remedied by the CHM and recent bottleneck with predictions made in this study, we can easily explain the diversity without contradiction.
The fact that this mitochondria region was reset during a recent worldwide bottleneck explains the pattern we see today, but only if the mutation rate is fast which all indicators seem to validate. These factors are the basis of my predictions and I can extrapolate that the region I have chosen to make my predictions on is indeed also fast since every region of the mitochondria tested thus far has been found to be fast. So it is not a stretch of the imagination to make the leap that this region as well ticks fast in all species alive as well.
Confirming
1:) All life is young, right out of a Global bottleneck and the evidence is undeniable (Thaler 2018). If big cats with longer generation times have near the same differences as small cats, it proves they cannot be separated by much time at all.
2:) Nucleotide changes are occurring fast in mitochondria and diversity is still increasing.
3:) With nothing over an average pairwise difference of over 0.5%, this is clear evidence that tells us a recent demise besets all life on Earth.
4:) Speciation happens fast, not slow as evolution theory has assumed and that Darwin predicted and is still claimed today. When paleontologist Steven M. Stanley (1998) examined fossil dynamics among different species; he suggested that it takes on average 1–2 million years to make new species, at least among mammals and vertebrates.
5:) Mutation rates are effected also by recombination rate's (Ingrid Berg et al 2011). Since this has shown us that recombination occures faster in Africans than Europen's, this explains why Africans look older genetically when in reality they are the same age.
The evidence is clear, evolution is a lie.
The waiting time to speciation will depend on many interacting factors, including the rate of supply of genetic variation, the level of gene flow between isolated populations, the nature of the genetic changes underlying reproductive isolation, population size, and nature of selective pressures. Many variables are to be considered, the neutral theory of mear generation time to explain everything fails.
Why is it important to use and consider observable mutation rates?
1:) We want to consider the divergence of an arbitrary number of species, not just a single pair of species;
2:) The substitution rate can vary between lineages;
3:) The fossil record is scarce, divergence times are unknown;
4:) We do not want to calibrate a clock with unknown speculative events in history to obtain a mutation rate. Far too many assumptions go into this. An accurate mutation rate takes away assumptions;
5:) Use of incorrect calibration point; and noise introduced from stochastic process of substitution (Wikstrom et al 2001).
6:) Fix incorrect tree branches. Also not to make use of, or correcting incorrect phylogenetic branches.
7:) Rate variations can invalidate the assumption of neutral theory method and resolve contradictory patterns;
8:) Recombination also invalidates the assumption of neutral theory method and resolve contradictory patterns;
9:) Saturation has yet to obscure the signal, so these rates especially in the Co1 gene are;
10:) Exclude combining nuclear DNA with mtDNA rates, as patterns of diversity contradict one another.
11:) Predictions can be made using an observable clock. If the observed fast rate is not accurate then predictions will fail and the empirical rate will be invalidated.
12:) Observed mutations can tell us that if mtDNA regions become saturated or reach equilibrium, then we can tell how old an organism is based on the mutation rate and total mutations that have occurred.
13:) We can use the observed mutation rate to determine what hypothesis accounts for the rate, whether it be metabolism, lifespan, generationtime, speciation, etc…
14:) Resolving incomplete lineage sorting discrepancies.
15:) Observed mutation rates determine the relatedness of people and who did or did not commit a crime.
16:) Obtaining accuracy of a bottleneck will help us determine how fast speciation is in all animal groups.
Until evolutionists can make future accurate predictions on speciation events, genetic diversity, and mutation rates. Their theory will remain unscientific and they will just continue to invoke that evolution can do anything and therefore is unpredictable and predictions cannot be me.
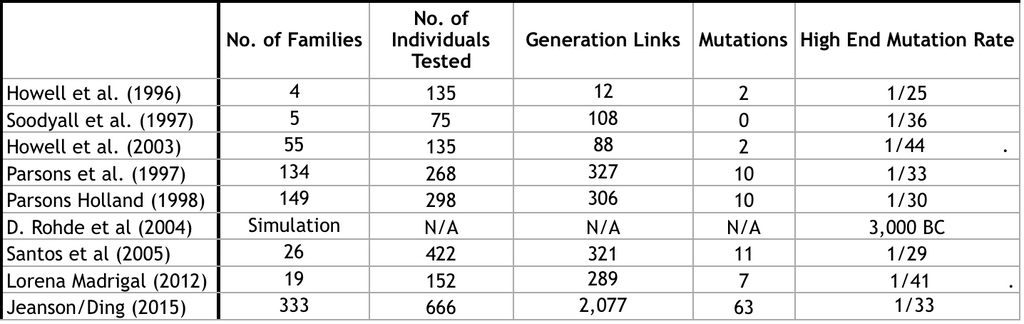
Dr. Natheniel Jeanson obtained a mutation rate Ding et al 2015 to obtain a mutation rate of 0.168 mutations per generation. His mutation rate is not far off from other pedigree studies. As shown below in table 1.
Since this is a stark difference from the evolutionary prediction, one must consider the alternative.
Consider what Lundstrom et al stated in 1992. The divergence predicted by Lundstrom was that 14 of every 1 million children will differ from their mother at a particular base pair within hypervariable region 1 (HVR1) in the coding region (D-loop). Since the sequence had a total span of 360 base pairs, it was predicted that 1/200 children will differ from their mother in that region.
Kocher and Wilson (1991) observed that 63% of all mutations in their sample of D-loop sequences occurred within a space of 400 base pairs that included the HVR1, Therefore Howell in 1997 estimated that 1/125 children should differ from their mother at some site within the entire D-loop. In other words, one mtDNA D-loop mutation should arise every 125 generations if the divergence rate predicted by Lundstrom et al is accurate.
In contrast to this was the evolutionary phylogenetic assumption, that predicted the ratio to drop to 1 child/400-1,200. Meaning they expected 1 mutation to arise every 800 generations on average, and up to 1 mutation every 1,200 years.
By analyzing a single deep lineage of related mtDNA sequences where they “know” the most recent common ancestor (MCRA). They can be certain that all new mutations that have arisen in that line are “new”. This brings us back to the discoveries of finding 1 mutation every 30-44 generations in many pedigree studies. Clearly incompatible with evolutionary timelines.
Conclusion
Regarding mutation rates and patterns it is clear that in hominidae, generation time plays the largest role in determining the mutation rate and population influx influences the mutation accumulation found within the species. This explains why humans who have the slowest mutation rate compared to primates have so few mutations in the population, while chimpanzees have so many mutations within their smaller more isolated populations within africa.
Within chimps, gorilla and pongo, lifespan also plays a factor. The correlation between how long the species lives also dictates how fast its mutation rate is. We find the faster mutation rate in the longest living primates ticks faster. Wild species of primates; Borean orangutan pongo have the fastest mutation rate and they also live the longest 35-45 years. Followed by the gorilla at 30-35 years and finally the chimpanzee at 15-30 (Christophe Boesch et al 2001). This is what makes humans very different as well as we have the longest lifespan of all and have the slowest mutation rate in comparison.
Felidae range between 98.6ºF - 102.2ºF body temperature. The marbled cat Pardofelis marmorata has the fastest mutation rate within the family. They live high in the Himalayas at around 8,200 feet. We know that cold increases metabolic rate and these cats live in very cold regions at high elevations. They have a moderate generation time with the range of reproductive maturity just 21-22 months. The next fastest mutation rate cat species is the bobcat “Lynx rufus” that lives in North America and ranges from Southern Canada to Oaxaca in Mexico. They are more active during the day in cold weather but mostly are active during twilight. They have a Basal metabolic rate of 23.4460 W with a body mass of 9400.0 g. This totals a Metabolic rate per body mass of 0.002494 W/g. With a much faster average reproductive maturity at 1 year for females and 2 years for males we see that a combination of metabolic rate trumps generation time. Let’s line up felids and see the trajectory.
Tigers have a Metabolic rate per body mass of 0.000971 W/g . Lions have a Metabolic rate per body mass of 0.000965 W/g. Jaguar have a Metabolic rate per body mass of 0.001238 W/g. Bobcat have a Metabolic rate per body mass of 0.002494 W/g. Ocelots have a Metabolic rate per body mass of 0.001654 W/g. Puma have a Metabolic rate per body mass of 0.001154 W/g. Cheetah have a Metabolic rate per body mass of 0.001607 W/g. Domestic modern typical cats have a metabolic rate per body mass of 0.00050 W/g. The trajectory is clear. Metastatic rates are the clear influencer of mutation rates in felidae. The correlation is too strong to be ignored. The metabolic factor is more of an influence than generation time alone when it comes to felidae. Generation time hypothesis alone cannot explain the pattern of diversity we see in Felidae nor the mutation rate. We see a clear trajectory; highest metabolisms -faster mutation rate - higher diversity.
Within canidae it is speciation, and geographical location and migration that influences the mutation accumulation rate more than anything else. Mutation rates however are driven by a combination of the metabolic rate hypothesis and generation time. For example the Crab eating Fox “cerdocyon thous” has a weight of 14 lbs and a body temperature of 100.8ºF with a basal metabolic rate of 21.5330 W. With a body mass of 7720.0 g. This equals a metabolic rate per body mass of 0.002789 W/g. With a generation time of 274 days or 9 months. Making it have the slowest mutation rate within Vulpes. The swift fox Vulpes velox has the fastest mutation rate and has Basal metabolic rate of 4.9480 W. With a body mass of 1769.0 g. This equals a Metabolic rate per body mass of 0.002797 W/g. With a generation time of 365 days or 12 months. This causes the Crab eating fox to have a slower mutation rate than the Swift fox. We notice this trend not just in foxes, but in Canis Lupus as well. Canis latrans aka Coyote has a weight of 29 lbs and a body temperature of 98.6ºF. With a basal metabolic rate of 19.4230 W. With a body mass of 10148.9 g. This equals a metabolic rate per body mass of 0.001914 W/g. With a generation time of 9-10 months, making its mutation rate slower than the Black-backed jackal which has a body temperature of 100.4ºF. A basal metabolic rate of 21.5330 W. With a body mass of 7720.0 g. This equals a metabolic rate per body mass of 0.002789 W/g. With a generation time of 8.2-10 months. The correlation between the metabolic rate hypothesis and generation time hypotheses best explain the correlation with the pattern of diversity we see within all canidae.
This means with just investigating three different animal families, we can see that the generation time hypothesis plays a major role and influences one family (hominoidea) with the longevity hypothesis affecting primates but not homosapiens, while the metabolic rate hypothesis controls and dictates the mutation rate in the other family (Felidae) while a combination of both dominates the outcome in another family (canidae). These results show us that multiple perspectives need to be taken into consideration when trying to figure out why different animal groups have different mutation rates and why different mutation rates even within the same species exist.

There is no doubt that mitochondrial DNA is the most popular marker of molecular diversity in animals, primarily because of its elevated mutation rate. Yet mtDNA hypermutability is still an unresolved issue and many theories have tried to resolve the contradictions found in Neutral theory to no avail. The problem is, that no one single thing is to blame for the discrepancies and the CHM has the most explanatory nature.
The neutral theory has always and still to this day predicts a wide range of variation in all life, with higher levels of variation in organisms that reproduce more rapidly, as the rate of diversity recovery after a genetic bottleneck is proportional to generation time (time to equilibrium variation is N generations; Hartl DL, Clark AG 2007; Bedford T, Cobey S, Pascual M 2011.) In contrast to this prediction, the widespread effectiveness of DNA barcoding reflects similarly low levels of intraspecific variation across the diversity of all animal life, including insects and vertebrates that differ 100-fold in generation time ( Hajibabaei M et al2006; Ward RD et al 2005).
The argument made by evolutionists for not finding geological evidence of a genetic bottleneck is using an argument that - since genes on the mitochondrial genome are strongly linked, an advantageous variant in one gene could potentially sweep to fixation through positive selection, bringing all variation on its particular genome with it (Maynard-Smith and Haigh 1974). This was originally proposed as a possible mechanism to reconcile peculiar patterns of diversity in the early 70s and lack of physical evidence for a bottleneck which still to this day remains a problem. Basically, it is just another way of saying, “well we discovered low genetic diversity exists in all life and we have no evidence for a bottleneck in our imagined geologic column, and this is the only other alternative explanation we can give for it, even though it has no evidence to back it up.” The main problem with this ad hoc rescue device hypothesis is that this “sweep” would have to occur in all animals both aquatic and land life worldwide at the same time. If they want to use hypothetical world wide selective sweep and selection as an explanation, then they need an example to show us, not just explain a hypothetical scenario. Since they have none, nor are able to make any predictions based on species for which diversity is unknown. Then the line of reasoning does not matter, since these are just so stories without evidence and without predictions. Nothing more than an excuse for the contradiction they find in nature.
Then there is the hurdle of natural selection to overcome rapid recombination that also speeds up point mutations. Since recombination is mutagenic even regarding point mutations, then this also reduces the effect of selection at any linked loci. Making not only mutation rates even faster, but making selection even less effective at removing mutations. This has been tested and observed in both humans and Drosophila (D. J. Begun et al 1992., M. W. Nachman et al 1998).
Even if selection theoretically could target and remove these neutral synonymous mutations. The power of selection to reduce the mutation rate is still limited by population size, by what is known as the drift-barrier (Lynch M 2011). So regardless of a random genetic drift, synergistic epistasis, or selection as alternative solutions that could possibly make an impact on mutation rates. There still remains a paradox related to the molecular clock that has not been resolved. In neutral theory, the molecular clock is proposed to be powered by drift and the clock rate equals µ (mutation rate per generation) (Kimura M 1968, Lanfear R, Kokko H, Eyre-Walker A 2014). Neutral theory predicts a chronologic clock rate proportional to generation time. However, multiple separate published studies have shown the mitochondrial molecular clock ticks at roughly the same rate in diverse animals with very different generation times (Weir JT, Schluter D 2008, Papadopoulou A, Anastasiou I, Vogler AP 2010). Even among mammals, mitochondrial evolutionary rates range from one substitution per 1-2 million years to one substitution per more than 100 million years. A difference of 2 orders of magnitude (Nabholz et al 2008). These clear contradictions are better resolved by uniting the metabolic rate hypothesis with the generation time hypothesis and Created Heterozygosity Model which considers a recent global bottleneck with fast mutation rates, causing rapid speciation and founder effect divergence. Taking animals from a heterozygous state to a more homozygous state over time.
So even if selection somehow overcomes this drift-barrier hurdle to actually affect mutation rates in the mitochondria. Selection would still have no impact on the conserved Co1 region since it has shown us we are only dealing with synonymous “neutral” single point mutations in the C0I gene. Also consider that Somatic mutations are not reduced to point mutations. Then we know we are not accidentally looking at somatic mutations in this region.
Considering we know that the species with the highest diversity today have lived to inherit the mutation difference we are now observing. There is no question regarding whether these mutations made it into the population, we know they did. They exist. Therefore The question is, how fast was this process? Does it really take 40 million years to make a single point mutation change in the Co1 gene of a 1,000 bp region like evolution predicts? Or is this mutation rate actually fast as predicted by YEC? Since ancestral polymorphisms still exist, mutation saturation has not yet reached (diversity is still increasing), patterns do not match evolutionary predictions, and large linkage blocks in the genome are still found. We can be very confident that we are looking at a young genome and recent bottleneck that reset mitochondrial diversity worldwide in all life.
We should not be surprised that mutation rates are highly responsive to environmental pressures. The metabolic rate hypothesis predicts that species with higher metabolic rates have increased mutation rates are due to mutagenic elements resulting from mitochondrial respiration. It is predicted that higher metabolic rates lead to more frequent mutations due to the increased production of free oxygen radicals generated during respiration escape in the mitochondrial electron transport chain that produces energy for the cell. (Andrew P. Martin 1993; Galtier et al 2009). Metabolic rates vary with activity level and environmental-climate conditions. More active animals have a higher metabolic rate than less active animals. Some animals enter a state of torpor in which their metabolism can slow down. Hibernation in the winter and estivation in the summer are forms of torpor. All of these factors play into different species mutation rates even within the same family. For example, in bears, we see more mutations in Pandas. Therefore it is concluded by evolution that they are the oldest bear species. Considering this bear species has the shortest generation time of all bear species, has the highest metabolic rate, does not hibernate, has a lower life expectancy than all other bears, and has moderately high levels of inbreeding. These factors have a huge impact on the higher diversity we see with this species. It is not that this bear species is older, they simply have more mutations from the above factors.
Overall mutation rates in different animal kinds are ultimately affected by a number of different biological aspects of the creature in question. The largest impacting factors within a species is that of generation time, body size, metabolism, maximum life expectancy, environment, geographic range, and inbreeding. Followed by population size and growth/dispersal rate in regards to fixation of these new arising mutations coming into the genome. Sometimes other external influences such as radiation or chemicals in our modern world known as mutagens can affect the rate as well. But overall, mutation rates, in general, would not be affected by these random rare outliers. They are exceptions to the rule, not the rule.
Therefore the Created Heterozygosity Model, incorporating the metabolic rate hypothesis and generation time hypothesis, while also taking into consideration where and how long the organism lives. All help us obtain an individual mutation rate in different creatures throughout the world and help us explain the observed patterns of diversity we see a lot better than the “neutral theory” hypothesis alone. No one hypothesis alone can explain the different mutation rates observed in different life forms nor the patterns we see. This is why evolution had to incorporate many contradictory theories like; gradualism (A slow gradual evolutionary process), stasis (where evolution doesn't move), saltationism (Sudden rapid evolutionary development), de-evolution (evolution in reverse), followed by punctuated equilibrium created by Eldridge and Gould which is idea that perhaps evolution is not a gradual process after all, but rather a process with distinct bursts of phenotypic and morphological change happen. (Eldredge and Gould 1972). All of these are falsification of the other and just ad hoc explanations for finding complete contradictions throughout the evolutionary made up idea. My framework outlined here explains why such a hypothesis had to be invented to save the theory because everywhere we look we see fast mutation rates and rapid speciation events.
Eight very well documented phenomena exist which contradict the evolutionary molecular clock-neutral theory. Namely, high metabolic rates (Gillooly et al 2005; Martin & Palumbi 1993), DNA repair mechanisms (Li et al. 1996), maximum lifespan expectancy, known as the longevity hypothesis (Samuels 2004) which was found to be stronger than that of either body mass or generation time (Welch et al 2008). Universal limited intraspecific variation within and between species using DNA barcoding (Thaller 2018), including a constant fast ticking universal molecular clock in all life. The created heterozygosity hypothesis predicts that genetic diversity for mitochondria originated recently and different rates of mutation are caused by rapid speciation rates and divergence as well. These rapid speciation events are also observed and well documented in everything from birds, plants, fish, and reptiles (Fan Han et al 2018; Joanna M. Buswell et al., 2010; Y. E. Stuart et al 2014; Fang Zhu et al 2013; Claire Brandenburger et al 2019; Hudson CM et al 2020), contrary to Darwinian evolution known as gradualism. Rather, the new observable data confirm predictions of the created heterozygosity model of creation. CHM states that genetic drift and recombination rates play a larger factor and this is exactly what we see when we study birds, as recombination rates in them correlate closely with chromosome size in avian genomes (Hillier, L. et al 2004). All of these published discoveries contradict key predictions of neutral theory. My predictions add credence to this evolutionary falsification by showing that the assumed calibrated Co1 rate of 1%/million years that is calibrated from fossils or older vicariant events (Crandall et al2012) is a presupposition. It is nothing more than an ad hoc explanation with the paradigm driving the conclusion.
The fact is, studies regarding molecular evolutionary rates have resulted in a wide range of different rates for diverse genes and taxa. More recent studies based on pedigree studies and population-level data have all produced unexpectedly high results of mutation rates, which strongly disagree with rates inferred in phylogenetic studies. This is why in 2005 Simon Ho et al concluded that it is invalid to extrapolate molecular rates of change across different evolutionary timescales. Moritz et al in 1987 was clear that the evolutionary phylogenetic mutation rate was not necessarily general to other lineages and neutral theory should not be inferred. This went ignored as evolution theory does what it always does and runs with something till it cannot then just ignore all falsification while at the same time begrudgingly admitting it was wrong.
These incorrect assumptions about evolutionary mutation rates are now easily falsified when you line up side by side comparisons of nucleotide divergences for Co1 sequences in primates. This shows us an average of 0.30% for conspecific comparisons and 5.88% for congeneric comparisons. Which are comparable with what is found among the barcode sequences of fish at 0.39% and 9.93% (Ward et al 2005) and birds at 0.43% and 7.93% (Hebert et al 2004). Concluding that a much more recent bottleneck of all life occurred, and the resetting mitochondrial diversity allows us to conclude that all the nucleotide differences we find in this region are new and have occurred after this bottleneck. Since different life forms have different levels of diversity even within the same related species, this is an invalidation of the evolutionary neutral theory hypothesis and evidence for the created heterozygosity model.
Brown et al in 1979 first made the mitochondrial molecular clock in primates based on fossil data. Their famous 2% per million-year rate was considered the best reference to use even in absence of fossil data regarding other mammals and vertebrates. However, since mtDNA variability is minimum across taxa and new discoveries show us that mutation rates are high. The conclusion is that our perception of deep evolutionary time was and still is incorrect and based on a misinterpretation of the data. If one were to take away the presupposition of evolution being true you are left with only the evidence that points right to a recent bottleneck with animal families having clear genetic boundaries (Thaller 2018).
The evidence could not be more clear, fast mutation rates with minimal diversity and low average pairwise difference between all life on Earth tells us unequivocally that all life went through a very recent bottleneck and a universal molecular clock described in neutral theory is wrong. The patterns we see are best explained from a recent bottleneck with fast mutation rates explaining the diversity we now see.
In conclusion, we now have the first-ever predictions based on fast mutation rates in a highly conserved gene that does not undergo selection. in multiple diverse species and a recent bottleneck. We see diversity still increasing today and can better explain the patterns of diversity with the Created Heterozygosity model combined with the metabolic rate hypothesis, generation time hypothesis along with considering how long an organism lives. With secondary considerations of factors such as migration, dispersal rate, geographic range size, population growth rate, inbreeding, and environmental conditions (temperature). We are able to not only delineate between different created kinds by observing ancestral pleomorphism and large linkage blocks that should not be there if deep time is true. I am also confident that the Co1 gene is a fast mutating region since every other region of the mitochondria tested thus far has been. Including all 37 genes, hypervariable regions, individual gene fragments, including the D-loop aka control region. Stack this with the fact that mutation saturation has not been reached and we have a trifecta of evidence that potentially confirms Young Earth Creation via the Created Heterozygosity model.
Discussion
The universally shared molecular clock idea is dying out. The neutral theory proposes that specifically in mammals, neutral evolutionary rates depend only on generation time, while non-synonymous rates depend solely on population size (Nikolaev et al 2007). What DNA barcoding sequences have shown us, however, is that mammals show a much higher mean of intraspecific divergence values compared to that of all other animal groups. Validating that generation time is only part of the factor playing into the mutation rate of species in question. Life expectancy can also play a major role rather than generation time alone. When we look at different Co1 values, they ranged from 0.60% to 1.1% in mammals (Lorenz et al2005, Hajibabaei et al 2006, Clare et al 2007; Borisenko et al 2008; Cai et al 2011) and less than half in other animal groups; 0.17% to 0.46% (Ward et al 2005; Kerr et al 2007; Hajibabaei et al 2006; Maturana et al 2011). These overall low differences, with high rates of change, do tell us a recent bottleneck occurred and the patterns cannot be explained with traditional neutral theory.
Since higher nuclear DNA diversity observed in marine vs. non-marine species, in invertebrates vs. vertebrates, and in small vs. large organisms, is not in line with patterns of mtDNA diversity (Leffler et al 2012; Bazin, Glémin & Galtier, 2006). Then the best way to explain the patterns is by the Created Heterozygosity Model (CHM). This means looking at the nuclear DNA as originally created with already diversity built-in so that the first created kinds of all life would have been able to create diverse offspring without complication. “The nuclear DNA clocks are not the product of mutation, and this interpretation is in error. Unlike mitochondrial DNA, nuclear DNA comes in two copies and is inherited from both parents, which means that DNA differences in offspring are the result of DNA mutation and of pre-existing DNA variation in the parents. For example, under the creation model, some of this pre-existing variation in humans traces back ultimately to the two parents, Adam and Eve, whom God created with pre-existing DNA differences. When this fact is accounted for, nuclear-genetic clocks point to recent creation, not millions of years.” And looking at mtDNA has each having their own brand new mitochondria without any mutations at all. After “the fall” mutations started building up and reduced during the Global flood bottleneck and started accumulating mutations all over again after that point. So we have two events in the past, creation where the most diversity would be seen, then the Global flood bottleneck which would have reduced all the animal species into just one species, limiting genetic diversity and restarting mtDNA within the creatures.
According to the CHM if we want to see what is more related, then we want to look at nuclear DNA followed by functional differences. If we want to test how old the species is, we focus on the mtDNA, not nuclear DNA. Yes, nuclear DNA does mutate at a rate of 78 base pairs per generation in both humans and chimpanzees, so a clock and predictions can be made. Dr Jeanson has compared these two in “Replacing Darwin”, but we will stay focused on the contradictory differences between mtDNA and nuclear DNA comparisons. Comparing nuclear DNA we can see that the sloth bear is closest to the sun bear for example. Yet mitochondrial DNA analyses and morphological studies placed sloth bears outside of all other ursine bears (Kutschera, V. E. et al 2014., Bidon, T. et al 2014., Pagès, M., et al 2009). Yet nuclear gene analyses favor a position close to sun bears ( Krause, J.et al 2008., Abella, J. et al 2012, Kutschera, V. E. et al 2014). This paradox is resolved only through the CHM. In the CHM, if we want to see what is related we want to trace nuclear DNA patterns of relatedness and see if the species closest to it carries similar DNA functions, orphan genes and can be in vitro fertilized, if so they are related. These other steps are often required because nuclear DNA is difficult to compare across species and since nested hierarchical patterns contradict when comparing anatomical, mtDNA, nuclear DNA, and non-protein coding nuclear DNA. Then we have to look to functional DNA differences as to what determines relatedness. This is what discriminates between the CHM and evolutionary models. These contrasting predictions by the evolutionary model and CHM allow for a head to head comparison regarding the nuclear genes and mtDNA mutation rates.
~ Robert W. Carter 2014 noted that we should be viewing mtDNA as starting off new and void of all mutations with no differences within related animal kinds at creation. This allows us to observe the fast rates of mutation in the mitochondria and take that back to a point of no mutations and make predictions based on what we would expect to see if life was far more recent. Unlike the genes in nuclear DNA, which can differ greatly from species to species, all animals have the same set of mitochondrial DNA, providing a common basis for comparison. Especially since mtDNA evolves fast enough to provide sufficient variation for the estimation of mutation rate (μ) over a two-decade period (Drummond et al 2003). This way we do not bother trying to reconcile the discrepancies between nuclear and mitochondrial rate differences, as they have no bearing on one another.
The Worldwide pattern of limited variation within species, with slightly larger differences between species, makes not only identification of separate Biblical “kinds” possible. But it also leads to future testable predictions that are the gold standard of science and any good theory. The easiest part about identifying an original kind with DNA barcoding is that even new species born today still retain ancestral polymorphisms (variants that arose by mutation prior to the speciation event that generated the species in which they segregate). Confirming multiple important things.
1:) All life is still very young and identifiable within and between species.
2:) Identification of created kinds is made much easier now as variants that arose by mutation prior to the speciation event were generated by the species in which they segregate from and can be traced back in time to their inevitable origin.
3:) Their presence complicates the evolutionary interpretation of molecular data and leads to incorrect phylogenetic inferences because taxonomic boundaries are crossed in the evolutionary paradigm. These ancestral polymorphisms point right to the species founder, the basal kind of each lineage. This is why evolutionists invoke incomplete lineage sorting and convergent evolution to try and deal with this problem.
4:) Large linkage blocks in the genome are still visible, something that if a lot of time had passed would not be the case.
5:) Genetic boundaries exist, we can see these limits within DNA barcoding.
6:) Mitochondria uniformity among all life tells us a recent worldwide bottleneck occurred and molecular clocks point to a MRCA for each different animal family just thousands of years ago.
The only odd diversity we ever get from barcoding comes down to two factors; hybridization or gene flow. However, since shared polymorphisms are otherwise uncommon in unrelated species, we can delineate what is related and what is not very easy now. We can clearly see that Neanderthal, Denisovan were never predecessors to modern-day people and were never hybrids at all. Rather all are clearly human, as DNA Barcoding shows us that three retain common ancestral polymorphisms from the root ancestor at this last bottleneck.
Since the Co1 gene is highly conserved, this explains why normal modern people have so few differences while at the same time explaining why Neanderthal and Denisovan had so many mutations. As highly conserved regions are also susceptible to faster rates of change but only from the worst scenarios like inbreeding. Their smaller populations would rapidly obtain more point mutations. Since selection has no effect on this region, it adds credence to why they had double what we have today over such a short time while the rest of humanity was growing in population size and migrating and expanding. Now if Denisovan and Neanderthal were hypermuting from isolation, inbreeding, iridium exposure in the northern atmosphere from worldwide volcanism, living in harsh freezing conditions. Including non-synonymous, synonymous and somatic mutations were building up even rapidly during their extended lifespans. Then we would expect to find these extra mutations in the mtDNA. Due to random extinction of lineages such as neanderthal, different branches of a reconstructed phylogeny will differ in how often they experienced such short episodes of accelerated substitution rates. This results in differences that may appear to be long branches of a lineage when in reality they are short lived hypermutated lineages.
Since DNA hyperdiversity is not uncommon in eukaryotes. Evolution must account for why mitochondrial (mtDNA) data retrieved by James et al 2016 shows us that in over 505 diverse animal species tested, all portrayed hyperdiversity when none was expected. Including many other studies where rapid speciation rates were observed in everything from birds, fish, plants, fruit flies, reptiles, and Nematoda (Fan Han et al 2018; Joanna M. Buswell et al., 2010; Y. E. Stuart et al 2014; Fang Zhu et al 2013; Claire Brandenburger et al 2019; Hudson CM et al 2020). It is clear that fast mutation rates and speciation is occurring much more rapidly than predicted by evolution and we can see this in multiple separate phyla (Chordata, Arthropoda, Plantae). Even a fast mutation rate beyond the error threshold has been reported as causing the extinction of yeast lines (Herr et al 2011).
This is why I believe we must investigate the observable data via pedigree studies on mtDNA regions such as the Co1 gene to obtain a true rate of change. Since selection does not remove mutations arising in this region of the mitochondria, and the small population tribes that Neanderthal lived in, explains why we find the Co1 diversity in neanderthal between 8-18. Yet in modern-day people today who have between 0-10. In the entire mitochondria, modern-day people have a maximum of 24 fixed substitutions. As where Neanderthal ranged from 20 -36 fixed substitutions. Clearly, they fall within the range of humans, but their inbreeding topped with small population size and living in the North during the post-flood harsh ice age. All these factors built up point mutations rapidly without selection able to remove them, that they are considered to be an outgroup of humanity, subhuman.
They made a retrodiction before all the evidence was in, then they had to alter the evidence after they discovered all humans share at least some Neanderthal DNA. Another thing evolution did not predict and ended up causing them to alter their preconceived notion. They were never a population that existed prior to us nor gave rise to us but were just an offshoot group of small populations that were diseases and inbred who seldom crossed paths with other people groups and intermingled.
It is simple. Neanderthals and Denisovan having more mutations than modern-day people are what deemed them older than humanity by scientists. Since as you know, evolutionists believe mutation rates have either remained constant and slow throughout evolutionary deep time or have only recently sped up. This explains their rationalization regarding Neanderthal having had more mutations, therefore, they must be older. Is flawed, just as it is with panda bears. Another explanation easily explains why they have more mutations, but to evolutionists, these extra mutations with higher diversity are why they are considered either subhuman predecessors, or a subspecies today. Including a few morphological features that they advocate are primitive features like their enlarged longer skull case, protruding brow ridge, and the receding angle of their chin. The reality is, their morphological features are better explained by inbreeding, and their skull shape/features are governed by genetic influences found in genes expressed in the human brain. So far a single locus, the LD block on chromosome 10 in the GPR26 gene which encodes a G-protein coupled receptor, showed the association with the skull structure of neanderthal discovered by Michael D. Gregory et al 2017. Though they stated in the study that it's likely that other genetic loci are also involved, they were yet to identify any and would need a larger sample size to prove it. So we have clear evidence that the morphological differences we see in neanderthal were nothing more than genetic abnormalities. We also know that as time went on Neanderthal just became more isolated and more inbred, before eventually dying out. This is why we should not use mitochondria as a marker regarding Neanderthal and Denisovan since it is well known that isolation by distance makes it unsuitable for reliability (Peter R. Teske et al 2018). Including the fact that Ohta, 1992 stated; “slightly deleterious changes (s < 0) will be nearly neutral and are more likely to go to fixation by chance in a smaller population”. Also, Eyre-Walker and Keightley in 2007 concluded; “The substitution of deleterious mutations will be faster in small populations and the effect is greater in a declining population. Given that advantageous mutations are relatively rare compared to deleterious mutations”. The rate of acquisition of reproductive isolation increases quadratically with genetic differences between populations is called the snowball effect (Orr, 1995). Multiple empirical studies have given some support for the snowball effect (Matute et al 2010; Moyle and Nakazato, 2010; Wang et al 2015). Clearly, the observation that they would have had more point mutations because of these facts points to a conclusion that they were not an older population. Rather, they were suffering as many isolated, inbred species suffer today. However unlike animals, without the ability to speciate and diverge.
We as human beings alive today still retain large linkage blocks in our genome that have not been recombined in all of human history. This makes sense only from a young-Earth Creation perspective. But not evolutionary, since recombination would have altered every single linkage block there is and no evidence of them would be found. Picture a chain-linked together that slowly loses a link from the ends every decade. The chains wouldn’t exist after hundreds of thousands of years at the rate the links are breaking today. Yet we still find these long connected chains linked together in our genome throughout all of humanity.
So even when studying humanity’s age, mitochondria has been an invaluable tool. The fact that Africans have much higher rates of recombination than other people groups (Ingrid L. Berg et al 2011) is even more evidence that gives the appearance of age to Africans when in reality humanity is all the same age. Including the rates of rapid mutations occurring in the mitochondria, yet minimal overall change confirms that humanity cannot be old. Carter RW 2007 using a data set of 827 carefully selected sequences, was used to create a worldwide human mitochondrial consensus sequence to explain the origins of modern humans. It is shown that modern humans contain extremely low levels of divergence from the mtDNA consensus sequence, differing by a mere 21.6 nucleotide sites on average. A comparison of this consensus sequence to several ancestral sequences derived from phylogenetic studies reveals a great deal of similarity. Meaning that finding many ancestral sequences in modern-day people, is only possible if not a lot of time has passed. Since Adam and Eve were created with nuclear DNA differences, meaning that their genomes were the first haplotype blocks in all of human history. Their “haplotype blocks” were, essentially, the length of entire chromosomes. Since then, every recombination and gene conversion event has been fragmenting these initially long blocks into smaller haplotype blocks. The fact that we still find these blocks at all is contradictory to deep time evolution.
By multiplying the observed published rate of recombination (Wang et al 2012) and several estimates of the frequency of gene conversion (Wang et al 2012; Palamara et al 2015; Williams et al 2015) dr Jeanson combined into a total rate of haplotype block division per generation. This was used by Dr. Jeanson to predict how many blocks would have arisen in each individual after 6,000 years. The combined gene conversion and recombination rate was divided by a range of generation time estimates for humans to determine the rate of haplotype block divisions per year. Dr. Jeanson 2016 multiplying this converted rate by 6,000 years estimated the number of haplotype blocks that would have resulted from 6,000 years of recombination and gene conversion in each generation in a single lineage. The results showed us that the observable rates clearly point to a recent arrival of humanity. Clearly, the discrepancy between an ancient bottleneck and a recent bottleneck is at odds with one another and only one can be true. It's not a matter of if a worldwide bottleneck happened, it's when did it happen that is the question. It was stated by Thaler in 2018 regarding genetic data results; Namely that the extant population, no matter what its current size or similarity to fossils of any age, has expanded from mitochondrial uniformity and this is one of the clearest, most data-rich, and general facts in all of evolution. Clearly undeniable at this point, and this covers everything from bacteria, yeast, humans, fish, and land animals. Nothing was immune to Noah’s flood and now the genetic evidence confirms it.
What predictions are evolutionists making regarding the Co1 gene or its mutation rate? None. Thus far they only use the assumption that the fossil record is an accurate representation of time and all models are based on that. The only thing that has happened recently is that demographic models of expansion have shown how their evolutionary assumptions have failed. All 3 marine invertebrates tested in the Sunda Shelf were found to have extremely elevated rates of mutation in the Co1 gene compared to the previous phylogenetic rate (Eric Crandall et a2011). Much higher than the typical rate of 1%/million years that is calibrated from fossils. Considering those are still biased as well since they also incorporate evolutionary assumptions, the next logical conclusion will be that the entire phylogenetic model of history will be exposed when they test this region for the empirical rate.
As of yet, no pedigree studies have been done regarding the Co1 gene mutation rate that my predictions are focused on. So these novel future predictions, for now, remain to be validated. However, what makes my predictions more unique than others is that there is another way to test the validity of them, it is through mere waiting. If my predictions are correct, then merely waiting alone will result in newly visible mutations arising within decades from one another within and between species. Contrary to the current predicted value of the Co1 phylogenetic mutation rate of 1% per million years or 40 changes per 1,000 base pairs over 1 million years which is calibrated from the fossils or older vicariant events (Crandall et al. 2012).
Since neutral theory fails to accurately capture the pattern of diversity in different animal life and fails to explain the discrepancies of mutation rates of different life forms. It, therefore, invalidates evolutionary phylogenetic trees created that are based upon the assumed universal molecular clock proposed by neutral theory. Since it also fails to answer both important aspects of the evolutionary model that hangs upon neutral theory being true, then an alternative is greatly needed in the field of biological evolution.
Contradictions abound with neutral theory and diversity is better explained by the predictive power of the created heterozygosity model that accounts for factors outside a universally driven generation-time effect molecular clock ticking the same rate in all life. Including the fact that mutation saturation has yet to be achieved in the mitochondria and likely the Co1 region as well. Then we have not only evidence of a recent bottleneck, but a model that is just as explanatory as the evolutionary model regarding diversity we see if not more valid since we are the only ones making future testable predictions based on our model regarding future diversity. Evolution is not, because the theory is a post hoc model based on retrodictions after the evidence is already in. DNA barcoding is the most accurate measurement to date and it invalidates the Neutral theory of evolution. Kuhn TS (1996) suggests a new paradigm is needed regarding neutral theory and since that time no other theory has been allowed in science since evolutionism is protected by law.
Only time will tell as answers to my predictions begin to manifest. Even without future pedigree studies performed on the Co1 gene, mere time alone will reveal to us that diversity is still increasing and nucleotide substitutions are still occurring today within the Co1 gene and this alone will reveal the fast mutation rate predictions presented in this study. Since pedigree studies are currently lacking in Co1 research, I believe future results testing the Co1 gene using the pedigree method will also confirm the predictions made here. Together these different facets will bring to fruition the truth about our history, and conclusions will indicate that deep time evolution is incorrect and that a recent global catastrophe of Biblical proportions is true.
The “young” Earth view is a deduction from a number of biblical evidences and teachings, not a starting point. It follows from the biblical big picture that God created a perfect creation that fell because of sin. Without this “bad news”, the good news of the Gospel with the redemption from sin lacks any foundation.
References;
Pairwise differences were obtained from Bold Systems Barcode of Life Data System http://www.boldsystems.org/index.php
Pairwise alignment was done using EZ bio-cloud https://www.ezbiocloud.net/tools/pairAlign
Simon Y W Ho et al Time dependency of molecular rate estimates and systematic overestimation of recent divergence times DOI: 10.1093/molbev/msi145
Mark Y. Stoeckle, David S. Thaler Why Should Mitochondria Define Species? doi: https://doi.org/10.1101/276717
Christophe Boesch et al 2001 Mortality rates among wild chimpanzees https://www.eva.mpg.de/documents/Elsevier/Hill_Mortality_JHumEvo_2001_1556100.pdf
Janbin Wang et al 2012 Genome-wide Single-Cell Analysis of Recombination Activity and De Novo Mutation Rates in Human Sperm DOI:https://doi.org/10.1016/j.cell.2012.06.030
Pier Francesco Palamara et al 2015 Leveraging Distant Relatedness to Quantify Human Mutation and Gene-Conversion Rates DOI: 10.1016/j.ajhg.2015.10.006
Amy L Williams Non-crossover gene conversions show strong GC bias and unexpected clustering in humans doi: 10.7554/eLife.04637
Brown et al 1979 Rapid evolution of animal mitochondrial DNA DOI: 10.1073/pnas.76.4.1967
Dr. Nathaniel T. Jeanson On the Origin of Eukaryotic Species’ Genotypic and Phenotypic Diversity;
Hebert, Ratnasingham & DeWaard (2003) Hebert PDN, Ratnasingham S, DeWaard JR. Barcoding animal life: cytochrome c oxidase subunit 1 divergences among closely related species. Proceedings of the Royal Society of London B: Biological Sciences. 2003;270:S96–S99. doi: 10.1098/rsbl.2003.0025. DOI: 10.1098/rsbl.2003.0025
Fan Han et al Rapid hybrid speciation in Darwin’s finches DOI: 10.1126/science.aao4593
Claire Brandenburger et al,. Introduced daisy changes its appearance on Australian beaches, defying evolutionary expectations unsw.edu.au/
Joanna M. Buswell,. Is rapid evolution common in introduced plant species? https://doi.org/10.1111/j.1365-2745.2010.01759.x
Hudson CM et al,. The accelerating anuran: evolution of locomotor performance in cane toads (Rhinella marina, Bufonidae) at an invasion front. DOI: 10.1098/rspb.2020.1964
David,; Mech Wolf (Canis lupus) Generation Time and Proportion of Current Breeding Females by Age doi: 10.1371/journal.pone.0156682
E. Stuart et al,. Rapid evolution of a native species following invasion by a congener DOI: 10.1126/science.1257008
Poyarkov, A.; Ovsyanikov, N. (2004). Sillero-Zubiri, C.; M. Hoffmann; D. W. Macdonald (eds.). Canids: foxes, wolves, jackals and dogs. Status survey and conservation action plan. International Union for Conservation of Nature and Natural Resources/Species Survival Commission Canid Specialist Group. pp. 142–148.
Thomas et al. (2010) Thomas JA, Welch JJ, Lanfear R, Bromham L. A generation time effect on the rate of molecular evolution in invertebrates. Molecular Biology and Evolution. 2010;27:1173–1180. doi: 10.1093/molbev/msq009. DOI: 10.1093/molbev/msq009
Eric Bazin, Sylvain Glémin, Nicolas Galtier Population size does not influence mitochondrial genetic diversity in animals DOI: 10.1126/science.1122033
Fang Zhu et al 2013,. Bed bugs evolved unique adaptive strategy to resist pyrethroid insecticides https://doi.org/10.1038/srep01456
Robert W. Carter Mitochondrial diversity within modern human populations https://doi.org/10.1093/nar/gkm207
Alexei Drummond et al,. Measurably evolving populations DOI:https://doi.org/10.1016/S0169-5347(03)00216-7
Soo Hyung Eo, J Andrew DeWoody Evolutionary rates of mitochondrial genomes correspond to diversification rates and to contemporary species richness in birds and reptiles DOI: 10.1098/rspb.2010.0965
Ellen M Leffler, Kevin Bullaughey, Daniel R Matute, Wynn K Meyer, Laure Ségurel, Aarti Venkat, Peter Andolfatto, Molly Przeworski Revisiting an old riddle: what determines genetic diversity levels within species? DOI: 10.1371/journal.pbio.1001388
Hodgkinson, A., Eyre-Walker, A. 2011; Variation in the mutation rate across mammalian genomes DOI https://doi.org/10.1038/nrg3098
Andrew P Martin 1993 Body size, metabolic rate, generation time, and the molecular clock https://www.pnas.org/content/pnas/90/9/4087.full.pdf
Michael Lynch 2011; The lower bound to the evolution of mutation rates DOI: 10.1093/gbe/evr066
Michael Lynch 2016 Genetic drift, selection and the evolution of the mutation rate DOI: 10.1038/nrg.2016.104
Kimura M (1968) Evolutionary rate at the molecular level. Nature 217: 624–626. DOI: 10.1038/217624a0
Ward RD, Zemlak TS, Innes BH, Last PR, Hebert PDN (2005) DNA barcoding Australia’s fish species. Philos Trans R Soc Lond B Biol Sci 360: 1847–1857. DOI: 10.1098/rstb.2005.1716
Hajibabaei M, Janzen DH, Burns JM, Hallwachs W, Hebert PDN (2006) DNA barcodes distinguish species of tropical Lepidoptera. Proc Natl Acad Sci U S A 103: 968–971. DOI: 10.1073/pnas.0510466103
Bedford T, Cobey S, Pascual M (2011) Strength and tempo of selection revealed in viral gene genealogies. BMC Evol Biol 11: 220. DOI: 10.1186/1471-2148-11-220
Hartl DL, Clark AG (2007) Principles of population genetics, fourth edition. Sunderland: Sinauer Associates, Inc. 565 p.
Moritz et al. 1987 Evolution of animal mitochondrial DNA: relevance for population biology and systematics. Annu Rev Ecol Syst 18: 269-292
DOI: 10.1146/annurev.es.18.110187.001413
Kocher TD, Thomas WK, Meyer A, Edwards SV, Paabo S, et al. (1989) Dynamics of mitochondrial DNA evolution in animals: amplification and sequencing with conserved primers. Proc Natl Acad Sci U S A 86: 6196–6200. DOI: 10.1073/pnas.86.16.6196
Kerr KCR (2011) Searching for evidence of selection in avian DNA barcodes. Mol Ecol Resources 11: 1045–1055. DOI: 10.1111/j.1755-0998.2011.03049.x
Janzen Hajibabaei D. H. M., Burns J. M., Hallwachs W., Remigio E., Hebert P. D. N. Wedding biodiversity inventory of a large and complex lepidoptera fauna with DNA barcoding, Phil. Trans. R. Soc. Lond. B,
2005 In press URI: 10.1098/rstb.2005.1715
Martin & Palumbi Body size, metabolic rate, generation time, and the molecular clock PMCID: PMC46451 DOI: 10.1073/pnas.90.9.4087
Herman Pontzer Metabolic acceleration and the evolution of human brain size and life history doi: 10.1038/nature17654
Bromham et al Determinants of rate variation in mammalian DNA sequence evolution DOI: 10.1007/BF02202109
Gillooly et al The rate of DNA evolution: effects of body size and temperature on the molecular clock DOI: 10.1073/pnas.0407735101
David C Samuels Mitochondrial DNA repeats constrain the life span of mammals DOI: 10.1016/j.tig.2004.03.003
Welch et al Correlates of substitution rate variation in mammalian protein-coding sequences DOI: 10.1186/1471-2148-8-53
Nabholz et al The erratic mitochondrial clock: variations of mutation rate, not population size, affect mtDNA diversity across birds and mammals Published: 10 March 2009 DOI https://doi.org/10.1186/1471-2148-9-54
Nikolaev, S.I. et al. Life-history traits drive the evolutionary rates of mammalian coding and noncoding genomic elements. Proceedings of the National Academy of Sciences (USA) 104, 20443-20448 (2007).
Nabholz, B. et al. Strong variations of mitochondrial mutation rate across mammals- the longevity hypothesis. Molecular Biology and Evolution 25, 120-130 (2008)
Thomas, W.K. & Beckenbach, A.T. (1989) Variation in salmonid mitochondrial‐DNA – evolutionary constraints and mechanisms of substitution. Journal of Molecular Evolution 29, 233–245. DOI: 10.1007/BF02100207
Avise, J.C., Bowen, B.W., Lamb, T.A., Meylan, B. & Bermingham, E. (1992) Mitochondrial DNA evolution at a turtle's pace – evidence for low genetic‐variability and reduced microevolutionary rate in the testudines. Molecular Biology and Evolution 9, 457–473. DOI: 10.1093/oxfordjournals.molbev.a040735
Adachi, J., Cao, Y. & Hasegawa, M. (1993) Tempo and mode of mitochondrial DNA evolution in vertebrates at the amino acid level: rapid evolution in warm‐blooded vertebrates. Journal of Molecular Evolution 36, 270–281. DOI: 10.1007/BF00160483
Bowen, B.W., Nelson, W.S. & Avise, J.C. (1993) A molecular phylogeny for marine turtles – trait mapping, rate assessment, and conservation relevance. Proceedings of the National Academy of Sciences of the USA 90, 5574–5577. DOI: 10.1073/pnas.90.12.5574
Martin, A.P. & Palumbi, S.R. (1993) Body size, metabolic rate, generation time and the molecular clock. Proceedings of the National Academy of Sciences of the USA 90, 4087–4091. DOI: 10.1073/pnas.90.9.4087
Prager, E.M., Brush, A.H., Nolan, R.A., Nakanishi, M. & Wilson, A.C. (1974) Slow evolution of transferrin and albumin in birds according to micro‐complement fixation analysis. Journal of Molecular Evolution 3, 243–262. DOI: 10.1007/BF01796041
James et al. 2016 Mitochondrial DNA hyperdiversity doi: 10.7717/peerj.2549
Peter B Marko, 2002; Fossil calibration of molecular clocks and the divergence times of geminate species pairs separated by the isthmus of panama DOI: 10.1093/oxfordjournals.molbev.a004024
Michael D. Gregory et al,. July 2017 Neanderthal-Derived Genetic Variation Shapes Modern Human Cranium and Brain DOI
https://doi.org/10.1038/s41598-017-06587-0
Peter R. Teske et al,. May 31 2018 Mitochondrial DNA is unsuitable to test for isolation by distance DOI https://doi.org/10.1038/s41598-018-25138-9
Animal Generation time obtained from https://animaldiversity.org/
Okarma et al Basal Metabolic Rate in the Gray Wolf in Poland DOI: 10.2307/3801744
ZbigniewGłowaciński et al,. 1997 Potential impact of wolves Canis lupus on prey populations in eastern Poland https://doi.org/10.1016/S0006-3207(96)00067-5
Eric Crandall et a2011 Expansion Dating: Calibrating Molecular Clocks in Marine Species from Expansions onto the Sunda Shelf Following the Last Glacial Maximum DOI: 10.1093/molbev/msr227
James H. Brown et al,. 2004 TOWARD A METABOLIC THEORY OF ECOLOGY https://doi.org/10.1890/03-9000
Eyre-Walker A., Keightley P. D. (2007). The distribution of fitness effects of new mutations. Nat. Rev. Genet. 8 610–618. 10.1038/nrg2146 DOI: 10.1038/nrg2146
Ohta T. (1992). The nearly neutral theory of molecular evolution. Annu. Rev. Ecol. Syst. 23 263–286. 10.1146/annurev.es.23.110192.001403 https://www.annualreviews.org/doi/10.1146/annurev.es.23.110192.001403
Orr H. A. (1995). The population genetics of speciation: the evolution of hybrid incompatibilities. Genetics 139 1805–1813.
PMCID: PMC1206504
Matute D. R., Butler I. A., Turissini D. A., Coyne J. A. (2010). A test of the snowball theory for the rate of evolution of hybrid incompatibilities. Science 329 1518–1521. 10.1126/science.1193440 DOI: 10.1126/science.1193440
Moyle L. C., Nakazato T. (2010). Hybrid incompatibility ”snowballs” between Solanum Species. Science 329 1521–1523. 10.1126/science.1193063 DOI: 10.1126/science.1193063
Wang R. J., White M. A., Payseur B. A. (2015). The pace of hybrid incompatibility evolution in house mice. Genetics 201 229–242. 10.1534/genetics.115.179499 DOI: 10.1534/genetics.115.179499
Pagel M., Venditti C., Meade A. (2006). Large punctuational contribution of speciation to evolutionary divergence at the molecular level. Science 314 119–121. 10.1126/science.1129647 DOI: 10.1126/science.1129647
Bromham L., Hua X., Lanfear R., Cowman P. F. (2015). Exploring the relationships between mutation rates, life history, genome size, environment, and species richness in flowering plants. Am. Nat. 185 507–524. 10.1086/680052 DOI: 10.1086/680052
Welch J. J. (2004). Accumulating Dobzhansky-Muller incompatibilities: reconciling theory and data. Evolution 58 1145–1156. 10.1554/03-502 DOI: 10.1111/j.0014-3820.2004.tb01695.x
Irwin D. E., Irwin J. H., Price T. D. (2001). Ring species as bridges between microevolution and speciation. Genetica 112 223–243. 10.1023/A:1013319217703 https://pubmed.ncbi.nlm.nih.gov/11838767/
Coyne J. A., Orr H. A. (2004). Speciation. Sunderland, MA: Sinauer Associates, Inc Publishers. http://www.joelvelasco.net/teaching/2890/coyneorr04-speciationch1.pdf
Herr A. J., Ogawa M., Lawrence N. A., Williams L. N., Eggington J. M., Singh M., et al. (2011a). Mutator suppression and escape from replication error?induced extinction in yeast. PLoS Genet. 7:e1002282 10.1371/journal.pgen.1002282 DOI: 10.1371/journal.pgen.1002282
Hyper-speciation cases http://biomed.brown.edu/Courses/BIO48/23.Cases.HTML Meyer et al.1990 on African cichlid fishes
M W Nachman et al., 1998 DNA variability and recombination rates at X-linked loci in humans PMCID: PMC1460397
Abella, J. et al. Kretzoiarctos gen. nov., the Oldest Member of the Giant Panda Clade. PLoS ONE 7, e48985 (2012). DOI: 10.1371/journal.pone.0048985
Krause, J. et al. 2008 Mitochondrial genomes reveal an explosive radiation of extinct and extant bears near the Miocene-Pliocene boundary. BMC Evol. Biol. 8, 220 (2008). DOI: 10.1186/1471-2148-8-220
Kutschera, V. E. et al. Bears in a Forest of Gene Trees: Phylogenetic Inference Is Complicated by Incomplete Lineage Sorting and Gene Flow. Mol. Biol. Evol. 31, 2004–2017 (2014). DOI: 10.1093/molbev/msu186
Pagès, M. et al. Combined analysis of fourteen nuclear genes refines the Ursidae phylogeny. Mol. Phylogenet. Evol. 47, 73–83 (2008). DOI: 10.1016/j.ympev.2007.10.019
Bidon, T. et al. Brown and polar bear Y chromosomes reveal extensive male-biased gene flow within brother lineages. Mol. Biol. Evol. 31, 1353–1363 (2014). DOI: 10.1093/molbev/msu109
Hillier, L. et al. 2004 Sequence and comparative analysis of the chicken genome provide unique perspectives on vertebrate evolution DOI; https://doi.org/10.1038/nature03154
Anne C. Stone et al More reliable estimates of divergence times in Pan using complete mtDNA sequences and accounting for population structure doi: 10.1098/rstb.2010.0096
Donald W. Duszynski et al Late Pleistocene Vertebrate Records From South America https://www.sciencedirect.com/topics/immunology-and-microbiology/panthera & https://www.sciencedirect.com/book/9780128113493/the-biology-and-identification-of-the-coccidia-apicomplexa-of-carnivores-of-the-world
Brian David et al 2010 Tiger evolution http://primetimegh.com/all-it-rpfjoqi/def7af-tiger-evolution-tree
Lepage T., Bryant D., Philippe H., Lartillot N. 2007. A general comparison of relaxed molecular clock models. Mol. Biol. Evol. 24:2669–80 DOI: 10.1093/molbev/msm193
Eldredge N., Gould S.J. 1972. Punctuated equilibria: an alternative to phyletic gradualism. Models In Paleobiology. Freeman Cooper and Co. p. 82–115.
Howell et al., How rapidly does the human mitochondrial genome evolve? https://www.ncbi.nlm.nih.gov/pmc/articles/PMC1914922/
Parsons et al., A high observed substitution rate in the human mitochondrial DNA control region DOI: 10.1038/ng0497-363
Cristina Santos et al., Understanding differences between phylogenetic and pedigree-derived mtDNA mutation rate: a model using families from the Azores Islands (Portugal) DOI: 10.1093/molbev/msi141
Douglas L. T. Rohde et al., Modelling the recent common ancestry of all living humans https://www.nature.com/articles/nature02842
Lorena Madrigal et al., High mitochondrial mutation rates estimated from deep‐rooting costa rican pedigrees https://doi.org/10.1002/ajpa.22052
Drummond A.J., Ho S.Y.W., Phillips M.J., Rambaut A. 2006. Relaxed phylogenetics and dating with confidence. PLoS Biol. 4:e88. DOI: 10.1371/journal.pbio.0040088
H Soodyall et al., The founding mitochondrial DNA lineages of Tristan da Cunha Islanders DOI: 10.1002/(SICI)1096-8644(199710)104:2<157::AID-AJPA2>3.0.CO;2-W
Dr. Jeanson A Young-Earth Creation Human Mitochondrial DNA “Clock”: Whole Mitochondrial Genome Mutation Rate Confirms D-Loop Results https://answersingenesis.org/genetics/mitochondrial-genome-mutation-rate/
D J Begun et al,. 1992 Levels of naturally occurring DNA polymorphism correlate with recombination rates in D. melanogaster DOI: 10.1038/356519a0
Eric Riddell et al 2019 Cooling requirements fueled the collapse of a desert bird community from climate change https://www.pnas.org/content/116/43/21609 https://doi.org/10.1073/pnas.1908791116
Animal aging and longevity database; https://genomics.senescence.info/species/entry.php?species=Panthera_leo
TS Kuhn - Chicago, University of, 1996 The structure of scientific revolutions 3rd edition https://bit.ly/36wcYP7